
TGW Achieves Highest Revenue in Company History
Sep 26, 2020 at 7:55 PMDematic with Automation Contract at Reitan Distribution
Sep 27, 2020 at 9:07 AMIn the last eight years, Switzerland’s fish imports increased by nearly 2,000 to 35,299 tons. The most imported species was salmon, whose imports rose by 25 percent between 2012 and 2019; thus, this quantitative increase was five times more dynamic than that of total fish imports. Norway ranked first as a sourcing market.
(Bern) Overall, fish consumption in Switzerland increased: imports rose from 33,576 tons in 2012 to 35,299 tons (+5 percent) in 2019. Per capita, this corresponded to a quantity of 4.1 kilograms of fish and fish products. However, over the eight years, the imported quantity per capita decreased by 80 grams. For comparison: During the same period, imports of meat and edible by-products shrank from 102,652 to 82,301 tons (-20 percent).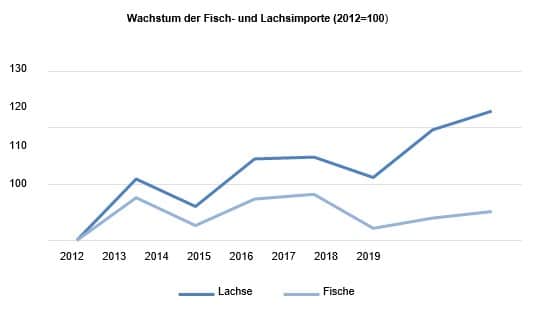 The development of salmon was particularly striking: salmon imports increased quantitatively by 25 percent from 11,000 to 14,000 tons over eight years. Compared to total fish imports, salmon imports grew five times more dynamically, increasing their share by 6 percentage points from 34 to 40 percent.
Main Source of Fish Comes from Europe
The majority of fish came from Europe (share: 81 percent). In 2019, Norway maintained its leading position with an 18 percent share. Over eight years, the Nordic country increased its fish deliveries by half. The Netherlands saw the largest increase at 51 percent, jumping from sixth to second place. France also increased its share from 9 to 10 percent, placing third behind the Netherlands. Imports from Vietnam fell by almost a fifth, causing the Southeast Asian country to drop from third (share 2012: 10 percent) to fifth place (share 2019: 7 percent).
Fish Imports of Switzerland by Country, 2012 and 2019
| 2012 | 2019 | Change 2019 / 2012 (in %) | |||
| Quantity (tons) | Share (in %) | Quantity (tons) | Share (in %) | ||
| Total | 33,576 | 100 | 35,299 | 100 | +5 |
| Norway | 4,234 | 13 | 6,345 | 18 | +50 |
| Netherlands | 2,587 | 8 | 3,913 | 11 | +51 |
| France | 3,068 | 9 | 3,489 | 10 | +14 |
| Denmark | 3,278 | 10 | 2,733 | 8 | -17 |
| Vietnam | 3,209 | 10 | 2,606 | 7 | -19 |
All figures mentioned in the press release are available online in the foreign trade statistics database: www.swiss-impex.admin.ch Graphic: © EZV Admin / Photo: © Loginfo24 www.ezv.admin.ch